
Table of Contents >> Show >> Hide
- Why “Expected Return” Matters More Than “Best Guess”
- What Major Institutions Are Signaling Right Now
- Macro Backdrop: The Arithmetic Behind Future Returns
- Expected Returns by Asset Class: A Practical 2026–2036 Range
- Portfolio Return Scenarios for the Next Decade
- Where Forecasts Usually Go Wrong
- A Smarter Playbook for 2026–2036
- Experience Section (Approx. ): What Investors Learn the Hard Way About the Next Decade
- Conclusion
If investing were a movie, most people would skip straight to the ending: “So… what’s the annual return?”
Fair question. But expected returns over the next decade are less like a spoiler and more like a weather report:
useful, directional, and occasionally wrong in dramatic ways. The goal isn’t perfect prediction. The goal is better decisions.
This guide synthesizes long-horizon views from major U.S. institutions and market data to build a practical framework
for 2026–2036. We’ll cover what the big firms are forecasting, what those forecasts are really saying, where investors
usually misread the signals, and how to turn return assumptions into a portfolio you can actually stick with when markets
get loud.
Why “Expected Return” Matters More Than “Best Guess”
“Expected return” is not a prophecy. It is a probability-weighted average across many outcomes. Think of it as a range
with attitude. A decade forecast can improve planning (retirement, spending rates, contribution targets, risk control),
but it should never be treated like a guaranteed destination.
Three Drivers That Usually Explain Most 10-Year Outcomes
- Starting valuation: the price you pay today has a huge effect on long-run return.
- Starting yield: bond yields and cash yields are the closest thing markets offer to a return anchor.
- Real growth + inflation regime: earnings growth, productivity, and inflation shape nominal returns and real purchasing power.
In plain English: if valuations are rich and yields are high, the next decade often looks very different from the last one.
What Major Institutions Are Signaling Right Now
The current consensus is surprisingly nuanced: long-run returns are still available, but the “easy beta” era is less obvious.
U.S. mega-cap concentration, higher starting bond yields, and a wider spread between market winners and losers are defining
the setup for the coming decade.
Consensus Snapshot (2026 Starting Point)
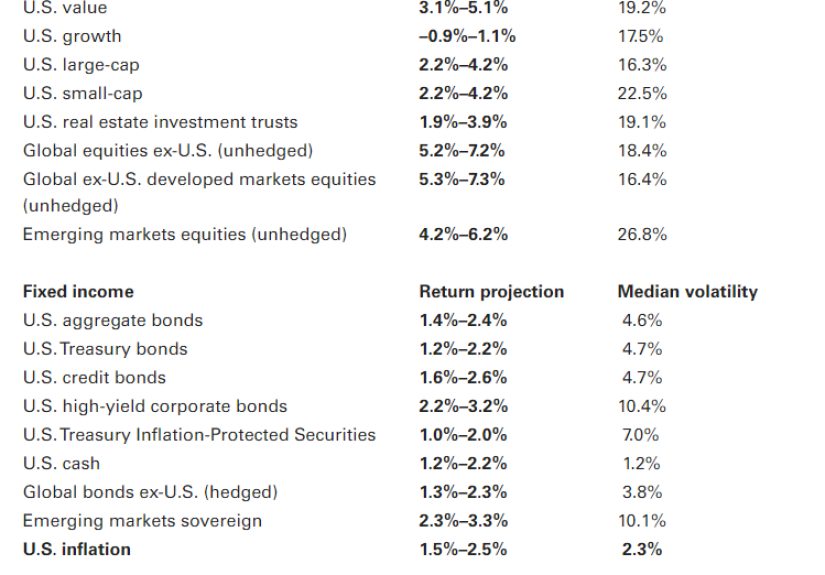
- Vanguard’s long-term outlook places U.S. equities around 3.9%–5.9% nominal annualized in one of its recent forward-looking ranges [1].
- Schwab’s 2026 long-term assumptions place U.S. large-cap and non-U.S. developed equities in the mid-to-upper single digits [7].
- Morningstar’s 2026 expert survey also points to mid-single-digit nominal expectations for U.S. large caps and investment-grade bonds [6].
- J.P. Morgan’s long-term assumptions emphasize that fixed income is no longer “return-free risk,” with materially better expected bond returns than the zero-rate era [4].
- Goldman Sachs highlights a constructive 10-year global equity outlook in nominal terms, while still flagging valuation dispersion and path volatility [5].
- AQR’s long-horizon estimates underscore the importance of real returns and inflation-adjusted planning, not just headline nominal numbers [8].
Translation: the next decade may reward disciplined diversification more than heroic stock-picking stories at dinner parties.
Macro Backdrop: The Arithmetic Behind Future Returns
Inflation Is Lower Than the Peak, But Not “Gone”
U.S. CPI data shows inflation has cooled from the shock years, with all-items and core-like measures in the mid-2% zone
in recent releases [12]. The Federal Reserve continues to communicate a longer-run 2% inflation objective [10].
That combination matters because real returns = nominal return minus inflation.
Yields Still Matter (A Lot)
The 10-year Treasury has recently sat around the low-4% range in official market series [11]. For bonds, your starting yield
remains one of the best predictors of long-term return. For portfolios, this is a structural change from the 2010s:
fixed income can again contribute both income and diversification instead of mostly moral support.
Policy Regime and the “Higher for Longer” Memory
Fed communication continues to stress uncertainty and data dependence while anchoring long-run inflation at 2% [10].
A world with moderate inflation, positive real rates, and non-zero term premium generally supports more balanced
stock/bond return contributions than the last decade’s valuation-led equity dominance.
Expected Returns by Asset Class: A Practical 2026–2036 Range
The ranges below are synthesis estimates built from institutional capital market assumptions and current macro conditions.
They are planning inputs, not promises.
| Asset Class | Estimated Nominal Annual Return | Estimated Real Annual Return (after inflation) | Why This Range Is Reasonable |
|---|---|---|---|
| U.S. Large-Cap Equities | 4.5%–7.0% | 2.0%–4.5% | High quality earnings base, but richer starting valuations and concentration risk [1][6][7]. |
| U.S. Small/Mid-Cap Equities | 6.0%–8.5% | 3.5%–6.0% | Potential valuation catch-up and cyclical upside, with higher drawdown risk [7][17]. |
| Developed ex-U.S. Equities | 6.0%–8.5% | 3.5%–6.0% | Valuation support and currency/earnings diversification benefits [4][9][15]. |
| Emerging Market Equities | 7.0%–10.0% | 4.5%–7.5% | Higher risk premium, stronger dispersion, bigger policy/currency swings [9][11]. |
| U.S. Core Aggregate Bonds | 4.0%–5.5% | 1.5%–3.0% | Starting yields are far more supportive than in the prior decade [4][6][11]. |
| Investment-Grade Corporates | 4.5%–6.0% | 2.0%–3.5% | Carry plus moderate spread risk in normal-growth scenarios [4][7]. |
| High Yield Bonds | 5.5%–7.5% | 3.0%–5.0% | Better carry, but default-cycle sensitivity remains key [4][11]. |
| Cash / Short Duration | 3.0%–4.5% | 0.5%–2.0% | Useful ballast and optionality, but weak long-run growth compounding [10][11]. |
If your reaction is “Those are lower than my social media feed promised,” congratulationsyou are now forecasting like an adult.
Portfolio Return Scenarios for the Next Decade
1) Conservative Income Portfolio (30% Stocks / 70% Bonds)
Expected nominal range: 4.2%–5.4% annually.
Likely strengths: smoother ride, stronger sequence-risk control near retirement, income visibility.
Main risk: inflation surprises can erode real spending power.
2) Balanced Portfolio (60% Stocks / 40% Bonds)
Expected nominal range: 5.3%–6.8% annually.
Likely strengths: classic diversification, improved fixed-income contribution versus the 2010s, reasonable drawdown tolerance.
Main risk: equity concentration and valuation resets can still hit hard in early years.
3) Growth Portfolio (80% Stocks / 20% Bonds)
Expected nominal range: 6.0%–8.0% annually.
Likely strengths: highest long-run growth potential.
Main risk: deep interim drawdowns that force bad behavior (selling low, buying back late).
Notice the theme: allocation discipline often matters more than squeezing an extra 0.4% from heroic forecasting.
Where Forecasts Usually Go Wrong
- Recency bias: assuming the next decade will copy the last decade.
- Valuation blindness: ignoring starting prices when projecting future returns.
- Inflation neglect: planning in nominal terms and forgetting real purchasing power.
- Concentration creep: accidental overexposure to one sector/theme.
- No behavior budget: building a portfolio that looks good in spreadsheets but is unbearable in drawdowns.
- Underestimating costs: fees, taxes, turnover, and timing errors quietly compound against you.
A Smarter Playbook for 2026–2036
Build Assumptions in Ranges, Not Points
Use base, optimistic, and conservative scenarios. If your plan only works at the optimistic assumption, it is not a plan
it is fan fiction.
Separate Strategy from Narrative
AI, reshoring, demographics, and policy changes matter. But long-run portfolio success still depends on:
valuation, diversification, costs, taxes, and staying invested.
Rebalance with Rules
Set drift thresholds (for example, ±5% allocation bands). Rebalancing forces “sell high, buy low” behavior without requiring
fortune-teller confidence.
Prioritize Real Return Goals
Define goals in inflation-adjusted dollars: retirement spending, education, financial independence, legacy planning.
Real goals reduce the temptation to chase nominal headlines.
Experience Section (Approx. ): What Investors Learn the Hard Way About the Next Decade
A recurring pattern across investor case reviews is simple: people rarely fail because they pick one “wrong” fund.
They fail because they build a portfolio they cannot emotionally hold. In one common example, a 40-something professional
entered the market after a strong bull run and set a personal minimum target of 12% annual returns “or it’s not worth it.”
The first volatile year arrived, returns fell below expectations, and every ordinary fluctuation felt like a broken promise.
The investor rotated repeatedly between aggressive growth funds and defensive assets, locking in losses and missing recoveries.
The lesson: expected returns are planning tools, not performance contracts.
Another frequent experience comes from concentrated success. A tech employee accumulated a large employer stock position
through grants and did very well for years. On paper, the portfolio looked excellent; in risk terms, it was one giant bet.
When sector concentration corrected, portfolio volatility exploded exactly when life obligations (mortgage refinance,
college savings contributions) were peaking. Diversification was postponed because selling winners felt painful.
Yet after gradually implementing a pre-set diversification schedule, total portfolio stress dropped, decision quality improved,
and long-term compounding became more reliable. The lesson: concentration can make you rich, but diversification helps keep you rich.
A third pattern shows up near retirement. Investors who expected bonds to remain structurally weak often stayed underweight fixed income,
then discovered too late that bond yields had reset to levels that can again support long-term planning.
In several retirement transition cases, moving from “all-equity growth mindset” to a deliberate stock/bond framework improved income visibility
and reduced sequence-of-returns risk. This did not maximize upside in every year, but it increased the odds of meeting spending goals across
many plausible market paths. The lesson: the best portfolio is not the one with the highest hypothetical return; it is the one that funds life reliably.
There are also newer investors who began during extraordinary macro swings, where markets moved from easy liquidity to tighter financial conditions.
Many initially treated every macro headline as a signal to overhaul allocation. Over time, the more successful investors adopted a boring but effective
process: monthly contributions, annual assumption updates, tax-aware rebalancing, and scenario testing every six months. Their result was not dramatic;
it was durable. They stopped trying to predict every quarter and started owning a decade-long process.
The shared experience across these cases is that behavior and structure matter as much as forecasting skill. Investors who define expected returns in ranges,
maintain a diversified allocation, and align risk with real-life cash flow needs tend to navigate uncertainty better than those chasing precise predictions.
The market rewards patience, but only if your strategy is designed to survive discomfort. Over the next decade, that may be the most important return advantage
of all.
Conclusion
Expected returns over the next decade likely look more balanced than the previous decade’s winner-take-most pattern:
moderate equity returns, materially better bond math than in the zero-rate era, and wider opportunity outside U.S. mega-cap concentration.
Investors who plan with realistic return ranges, inflation-aware goals, disciplined rebalancing, and cost control are more likely to win the decade
than those trying to nail every macro headline.
If you want one line to remember, use this: Forecast less precisely. Build more robustly.